

Pantalla de precisión, más allá de los límites
Introducción
A medida que aumenta el tamaño de los módulos, el uso de materiales no ha aumentado, sino que ha disminuido, lo que ha provocado altas tasas de rotura en los proyectos. ¿Cómo ocurrió esto y qué información oculta?
Tabla de contenido:
Capítulo 1: Una revelación sorprendente
Capítulo 2: Vidrio frágil
Capítulo 3: Prueba única
Capítulo 4: Camino a las soluciones
Capítulo 1: Una revelación sorprendente
El 20 de octubre de 2025, el canal de podcast sobre energía renovable SunCast publicó en LinkedIn que citaba los resultados de pruebas realizadas por el tercero independiente Kiwa PVEL y revelaba un fenómeno impactante.
Kiwa realizó pruebas de carga mecánica en una gran cantidad de módulos este año, y el 20 % falló bajo una presión estática de 1800 Pa. En contraste, la tasa de falla en 2024 fue solo del 7 %.

▽ Una publicación de LinkedIn en el podcast SunCast
Esta publicación cobró rápidamente popularidad en LinkedIn, lo que generó debates en la sección de comentarios sobre la validez de la tasa de fallos del 20 %. Sin embargo, a medida que más instituciones externas se sumaron al debate, se hizo evidente que las altas tasas de rotura de módulos son ampliamente reconocidas en la industria.

▽ Pruebas de carga mecánica en el Laboratorio Kiwa
De hecho, ya en junio de este año, Kiwa invitó a 50 fabricantes de módulos a una evaluación completa del estado de sus productos. Kiwa también introdujo de forma innovadora un sistema de "Calificación de Confiabilidad" para ayudar a los usuarios a evaluar con precisión el rendimiento de los módulos de diferentes fabricantes.
Las pruebas se realizaron estrictamente de acuerdo con la norma IEC 61215, abarcando carga estática, carga dinámica, resistencia al granizo y rendimiento eléctrico. Los resultados mostraron frecuentes roturas de vidrio, desgarros del marco, daños en la caja de conexiones y otros problemas, con una tasa de daños general del 20 %.

▽ MSS (Secuencia de tensión mecánica)
La tasa de fallo de las cargas mecánicas es tres veces mayor que en años anteriores
La secuencia de prueba de carga mecánica de Kiwa incluye varios métodos de instalación, identificados por números:
Estas pruebas se clasifican claramente de mayor a menor en función de los requisitos de rendimiento mecánico. Kiwa utiliza este sistema de numeración para rastrear qué módulos superan cada prueba, lo que permite a los usuarios evaluar indirectamente la resistencia mecánica de los módulos.
Además de Kiwa, otras instituciones de terceros en todo el mundo también han notado el problema generalizado de la rotura de módulos en los últimos años.
En 2022, la FUSC (Universidad Federal de Santa Clara) estableció un sitio experimental de 100 kW en el sur de Brasil, equipado con módulos bifaciales sobre seguidores. En un año, 83 de los 158 módulos desarrollaron grietas en el vidrio, lo que representa una tasa de rotura del 52,5 %.
En 2023, el Laboratorio CFV mencionó en un intercambio en línea que sus datos de prueba mostraron que las tasas de falla de los módulos en 2023 fueron tres veces más altas que en 2018. Casi el 30% de los módulos probados por CFV fallaron bajo una presión de prueba de 1500 Pa.

▽ La resistencia a la presión de los componentes disminuye año tras año.
La tasa de fallos de los componentes aumenta año tras año.
En 2024, DNV publicó un informe técnico en el que afirmaba que, en un proyecto de seguimiento con módulos bifaciales en la región Asia-Pacífico, el 15 % del vidrio trasero de los módulos se rompió cuando la velocidad del viento superó los 15 m/s.
En febrero de 2025, el grupo de trabajo PVPS de la IEA publicó un informe sobre las tasas de fallas de los módulos, indicando que los módulos bifaciales con vidrio de 2 mm podrían experimentar tasas de rotura del vidrio trasero del 5 al 10 % dentro de los primeros dos años de instalación.
▽ Informes sobre daños en componentes por parte de PVPS y DNV
En marzo de 2025, la revista IEEE publicó un artículo que analiza las tasas actuales de rotura de vidrio de los módulos bifaciales y señaló que los primeros cinco años de un proyecto representan el período pico de rotura de módulos, con tasas de hasta el 17,5%.
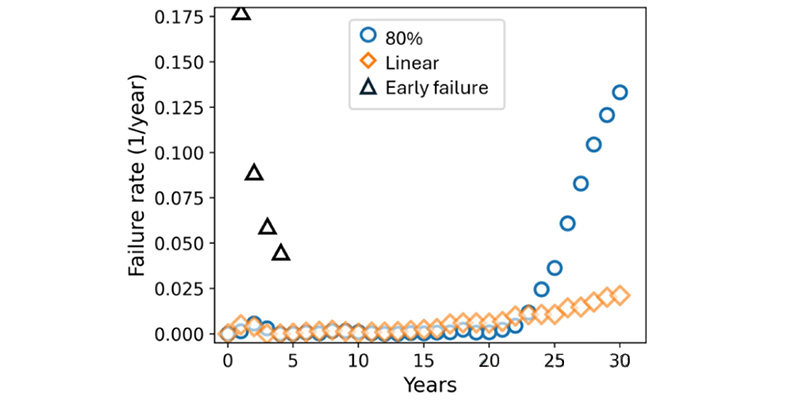
▽ La tasa de fallos de los componentes publicada en el IEEE Photovoltaic Journal
Parece como si, de la noche a la mañana, módulos que antes eran duraderos se hubieran vuelto frágiles, lo cual es desalentador.
Capítulo 2: Vidrio frágil
Desde que comenzó la tendencia hacia módulos más grandes en 2020, el tamaño de los módulos ha aumentado rápidamente, lo que significa que cada módulo debe soportar una mayor presión. Sin embargo, para colmo, el uso de material para módulos más grandes no ha aumentado, sino que ha disminuido:
• Espesor del vidrio: reducido de 3,5 mm a 2 mm
• Altura del marco de aluminio: reducida de 40 mm a 30 mm
• Espesor del marco de aluminio: reducido de 2 mm a 1,2 mm
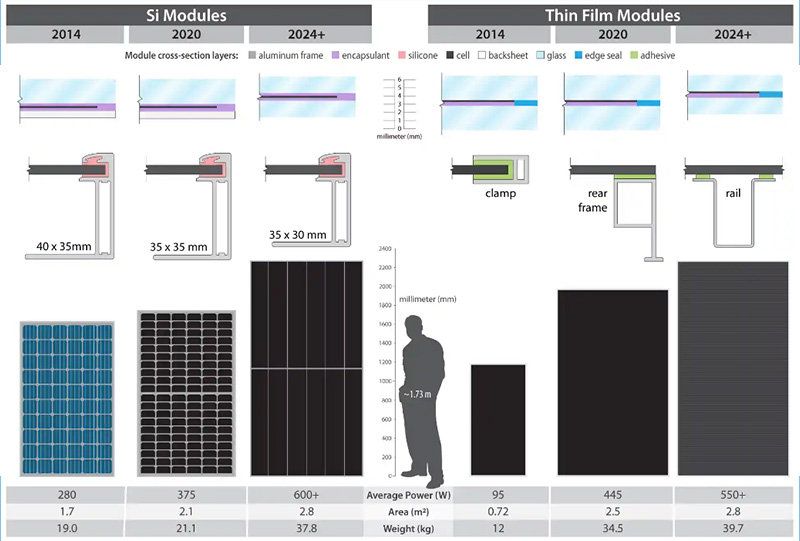
▽ A medida que aumenta el tamaño del componente, disminuye el uso de material.
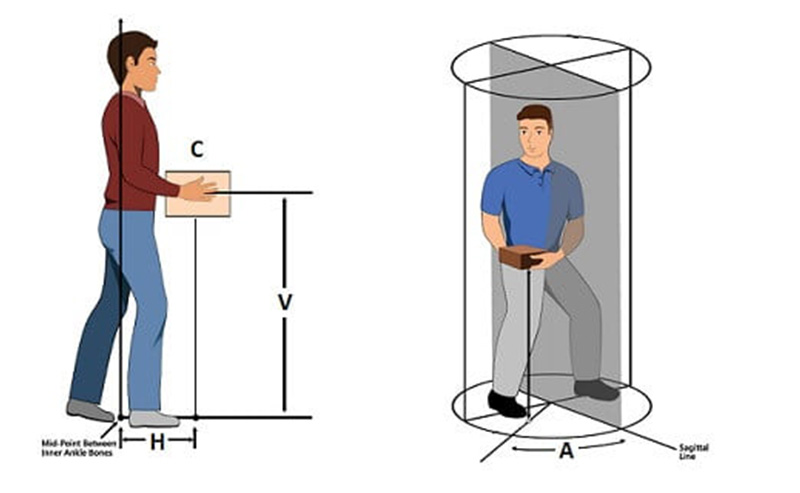
Si bien la reducción del uso de material ayuda a disminuir el peso total de los módulos, lo que agiliza la instalación, también plantea inquietudes. Según el Instituto Nacional para la Seguridad y Salud Ocupacional (NIOSH), el peso máximo recomendado para dos personas que levantan cada cinco minutos es de 33,5 kg.
Es evidente que si se mantuviera el uso de materiales de la era de los módulos de vidrio único, muchos módulos superarían ampliamente este límite de peso.
Por supuesto, se entiende ampliamente que el objetivo principal de reducir el uso de materiales es la reducción de costos.
Sin embargo, la reducción de costos ha conllevado inadvertidamente un menor control de calidad. La complejidad de producir vidrio de 2 mm está llegando al límite de la tecnología de fabricación de vidrio, lo que dificulta considerablemente el control de calidad en comparación con el vidrio de 3,2 mm.
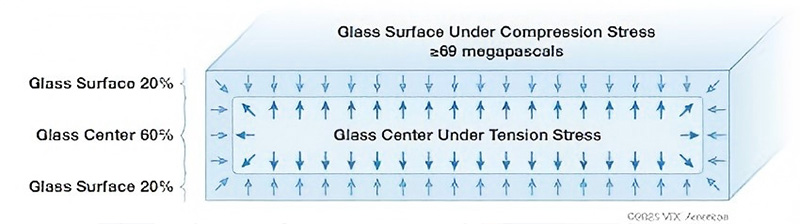
Para mejorar la resistencia a la rotura, el vidrio de los módulos fotovoltaicos suele someterse a tratamientos térmicos y químicos. La resistencia del vidrio depende en gran medida de esta capa superficial tratada y reforzada, que suele representar el 40 % de su espesor.
Durante la era de los 3,2 mm, los procesos de fabricación permitían crear eficazmente esta capa protectora. Sin embargo, mantener el mismo espesor en la era de los 2 mm se ha vuelto extremadamente difícil.
Actualmente, los patrones de rotura de vidrios gruesos y delgados en el sector han cambiado radicalmente. Anteriormente, las roturas de vidrios de 3,2 mm solían presentarse como grietas centrales, lo que facilitaba la localización del punto de falla. En cambio, las grietas de vidrios de 2 mm aparecen aleatoriamente, lo que dificulta enormemente identificar la causa de la falla.
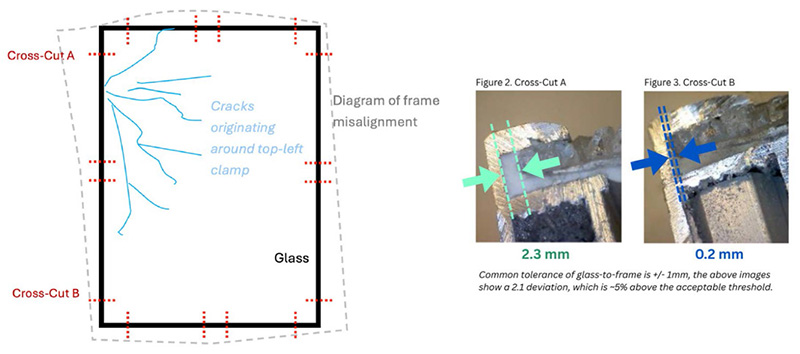
▽ Las diferencias en el proceso de producción de los marcos de los componentes también afectan las propiedades mecánicas de los componentes.
Esto dificulta la implementación de medidas correctivas eficaces cuando los módulos se dañan. Incluso si se reemplazan, pueden volver a producirse daños similares.
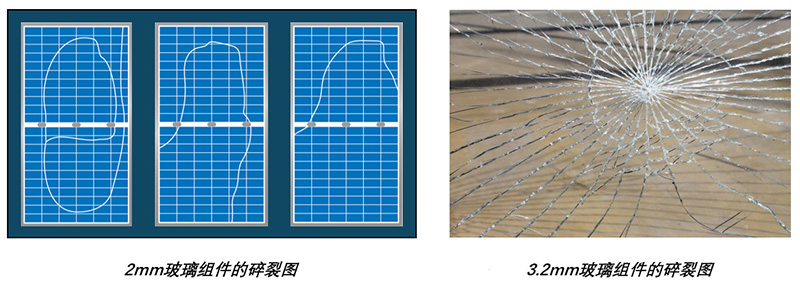
▽ La situación de la rotura de cristales de componentes ha cambiado
Capítulo 3: Pruebas individuales
Detrás del fenómeno de rotura de módulos en las obras hay otro factor crítico que no se puede ignorar. Cuando los fabricantes de módulos especifican el rendimiento mecánico, suelen basarse en los requisitos de prueba de la norma IEC 61215. La IEC proporciona un protocolo de prueba integral y especifica un factor de seguridad de prueba: r_m = 1,5.
Esta cueva publicó un artículo especial titulado "Cargas de prueba y cargas de diseño: ¿Cómo cumplir con los requisitos del proyecto?". La importancia de este factor de seguridad también se analiza en el texto. Los factores de seguridad del vidrio producido mediante diferentes procesos tampoco son los mismos.
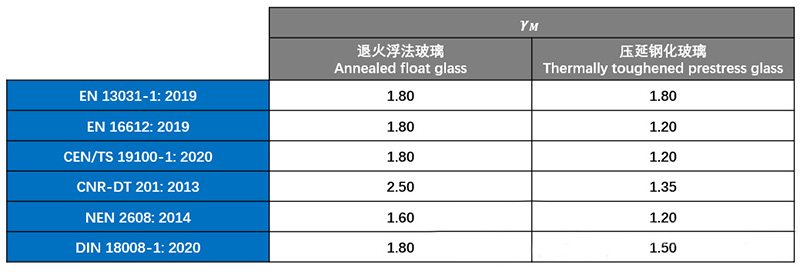
▽ Los factores de seguridad de los diferentes vidrios de proceso
La importancia de este factor de seguridad varía según el proceso de producción del vidrio. Debido a la aleatoriedad e inconsistencia inherentes a la producción de vidrio flotado, el margen de seguridad requerido suele ser mayor que para el vidrio laminado. Actualmente, los fabricantes de módulos suelen optar por vidrio flotado más económico para el vidrio trasero de los módulos. Como se muestra en la tabla, el factor de seguridad del vidrio flotado recocido oscila entre 1,6 y 2,5.
Por lo tanto, para los márgenes de seguridad de las propiedades del material, el factor de seguridad de 1,5 requerido por la IEC es claramente insuficiente.
Pero éste no es el problema más alarmante.
Al diseñar proyectos, se suele realizar una prueba de compatibilidad de módulos para determinar si un módulo específico se ajusta a la estructura del seguidor. Esta prueba aplica las cargas requeridas por el proyecto al módulo, según el seguidor y el método de instalación del módulo. La superación de esta prueba permite verificar que el módulo cumple con los requisitos del proyecto.
A primera vista, este proceso parece lógico y conforme. Sin embargo, pasa por alto un aspecto crucial: todas las pruebas se realizan solo una vez. Ya sea para proyectos pequeños de kW o grandes de GW, la fiabilidad de millones de módulos en una central eléctrica depende de una sola prueba con sacos de arena.
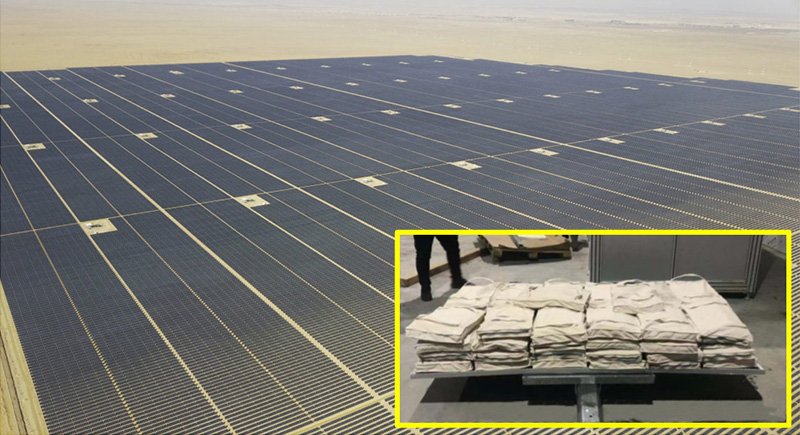
▽ El destino de toda una central fotovoltaica depende de una sola prueba de componentes
Es importante tener en cuenta que, incluso en módulos del mismo modelo, las características estructurales pueden variar debido a los diferentes lotes de producción. Esto significa que cada módulo es único, y las pruebas de un solo módulo no pueden reflejar de forma exhaustiva y precisa el estado real de todos los módulos.
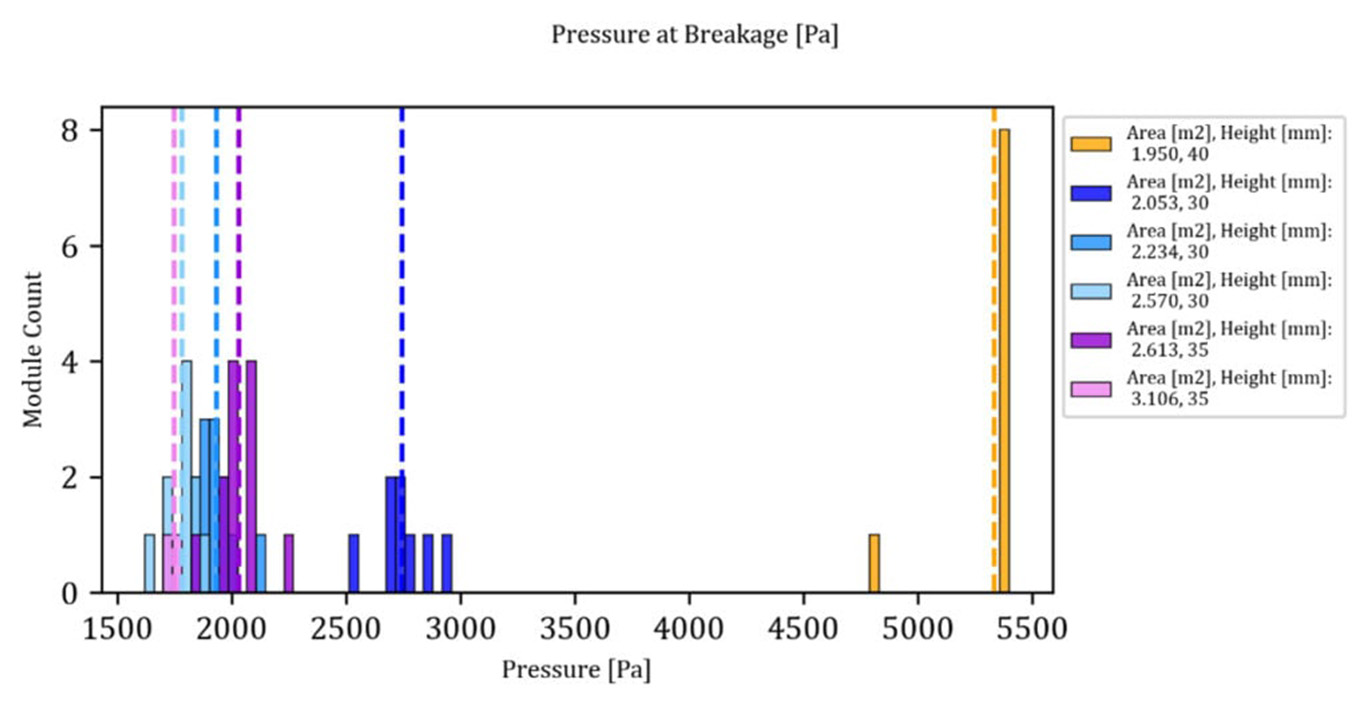
Las pruebas de carga modular son similares a las pruebas estructurales. En la industria estructural, obtener características estructurales precisas suele requerir extensas pruebas destructivas repetitivas (pruebas de fallo). Este método permite recopilar datos fiables para formar una muestra estable.
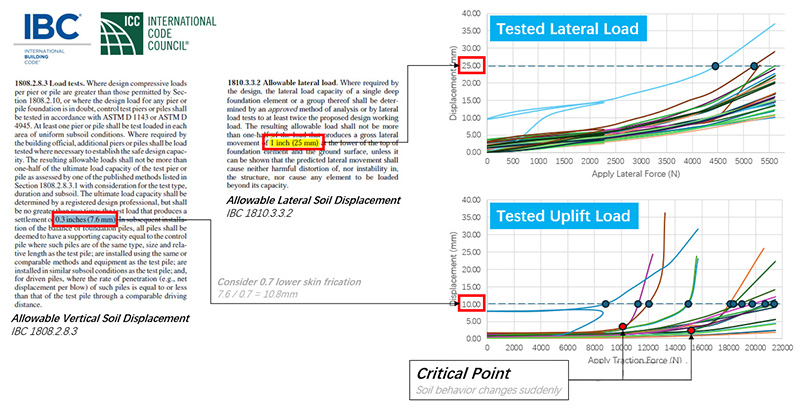
▽ Por ejemplo, en las pruebas POT, a menudo se requieren múltiples muestras y el límite de falla se mide repetidamente.
Cabe destacar que estas pruebas destructivas requieren un tamaño de muestra específico, generalmente de 25 a 50 módulos por grupo de muestra. Con base en estos amplios datos muestrales, se puede construir un modelo de distribución de probabilidad de Weibull y, mediante análisis estadístico, obtener el coeficiente de variación. Finalmente, este coeficiente de variación se puede utilizar para calcular el factor de seguridad correspondiente a la incertidumbre del material.
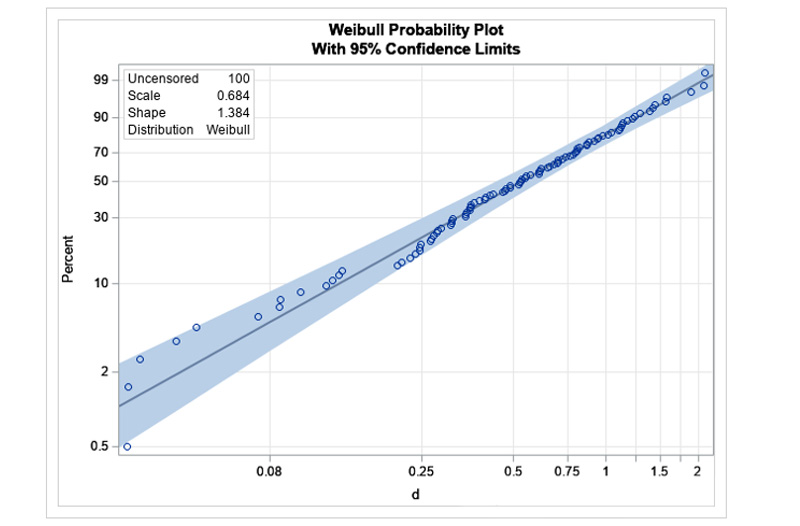
▽ En estadística, la distribución de Weibull se utiliza a menudo para determinar la probabilidad de fallo de un producto.
Capítulo 4: Camino a las soluciones
Este artículo se centra en la tendencia a largo plazo en la industria fotovoltaica: reducción de costes y mejora de la eficiencia. La reducción de costes no se limita a los módulos; bajo la enorme presión de los costes, otros equipos de sistemas también están explorando vías óptimas para reducirlos. Sin embargo, cuando las "nuevas tecnologías" de diversos fabricantes de equipos se aplican a nivel de sistema, aumentan inadvertidamente el riesgo de rotura de los módulos.
Las medidas habituales de reducción de costes para los fabricantes de rastreadores incluyen:
• Aumento del ángulo de estiba de 30° a 60°
• Reducción del espesor de las correas de 2 mm a 1,2 mm
• Aumento del espaciamiento entre columnas de 7 m a 10 m
• Cambio de estiba a barlovento a estiba a sotavento
• Adaptación al terreno doblando el eje principal y los módulos para reducir el movimiento de tierras.
Debido a las barreras del sector, la colaboración entre los fabricantes de módulos y seguidores es compleja. Como resultado, cada parte reduce sus propios costes y traslada el riesgo final a los usuarios del sistema.
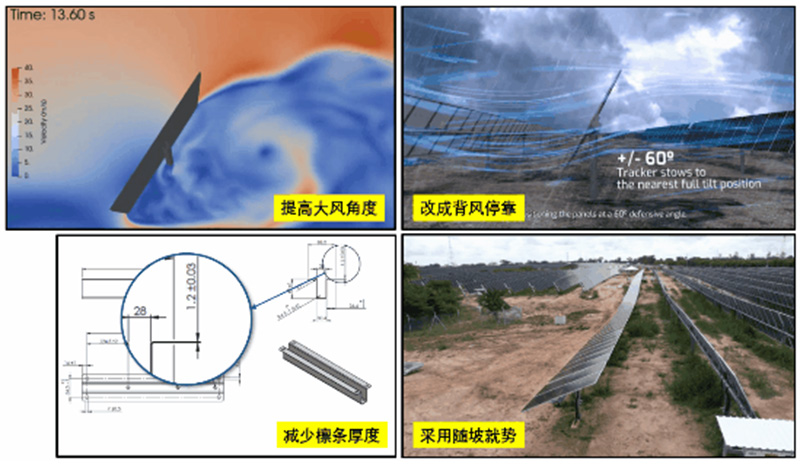
▽ Los rastreadores también están adoptando varias "nuevas tecnologías" para reducir costos
Sin embargo, no todos optan por "enterrar la cabeza bajo la arena". Cada vez más, las personas exploran activamente soluciones y proponen diversas ideas creativas.
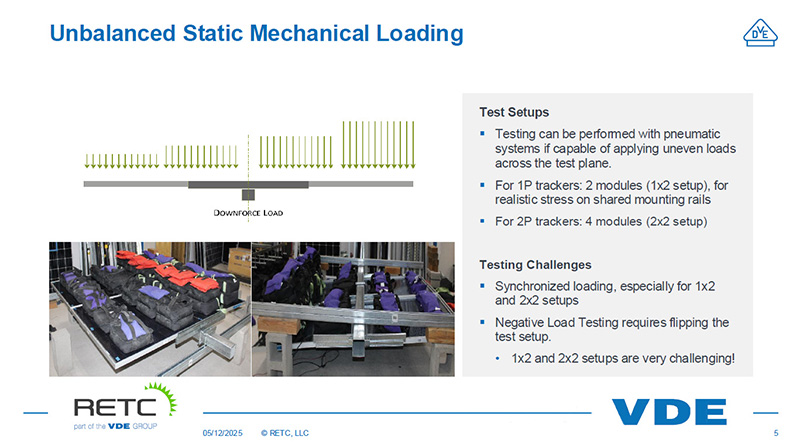
▽ VDE propone pruebas de componentes no balanceados
▽ Los marcos de acero pueden mejorar eficazmente la capacidad de resistencia a la presión de los componentes.
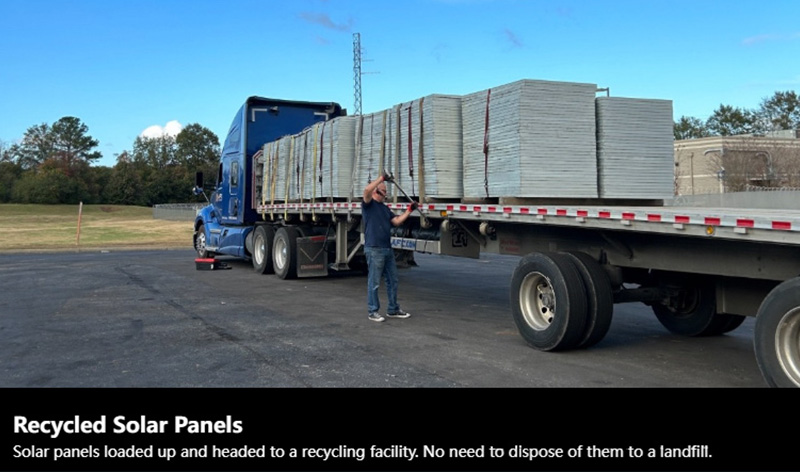
▽ La industria del reciclaje de componentes también ha surgido silenciosamente
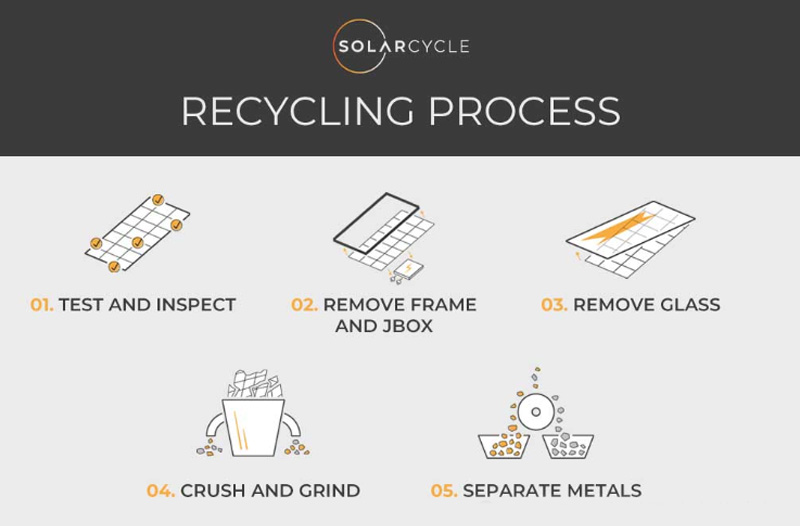
▽ El proceso general de reciclaje de componentes
En 2025, gracias al esfuerzo colectivo, el coste de la generación de energía fotovoltaica alcanzó un mínimo histórico. Entre los diversos métodos de generación de energía, la fotovoltaica se ha convertido en el líder indiscutible en LCOE (costo nivelado de la electricidad).
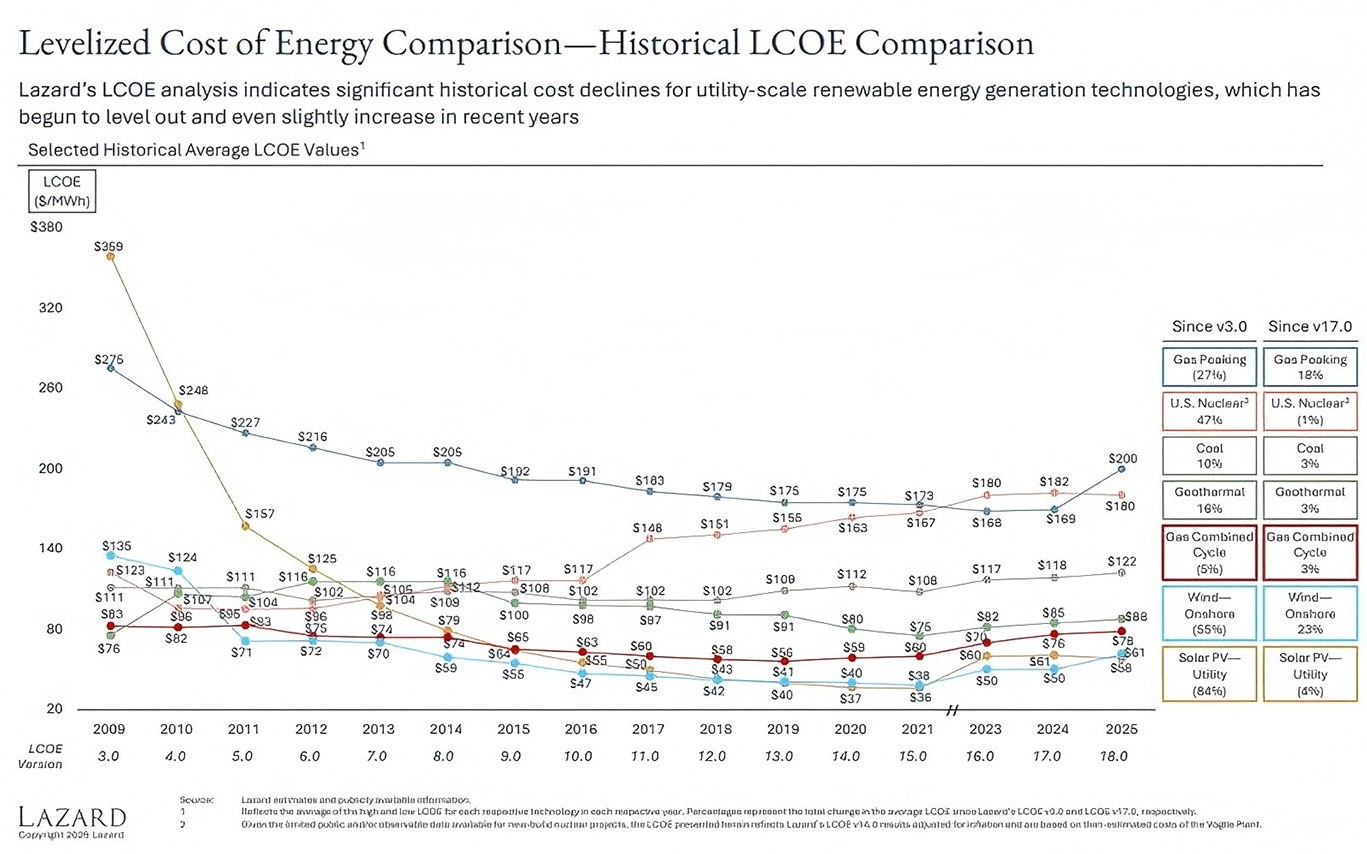
▽ La energía fotovoltaica se ha convertido en la fuente de energía más rentable para la generación de energía.
Este logro es inseparable de cada persona que lee este artículo. Trabajemos juntos para romper las barreras de la industria, afrontar los desafíos y aprovechar las mayores oportunidades de la era actual.


 Red IPv6 compatible
dejar un mensaje
Escanear a WeChat :

 Español


